A widely used (and very powerful) software development process is the Unified Process, of which IBM's RUP (Rational Unified Process) is currently the best example. But describing RUP would be too much.
What I can do is to introduce you to a formalised and standardised way of describing OO systems, suitable for applications of any complexity and with all possible development processes. This is the Unified Modeling(1) Language (UML).
UML is not a language in the traditional sense, but rather a set of symbols and rules to produce diagrams. The standard is freely downloadable from the Object Management Group's web site (http://www.omg.org/technology/documents/spec_catalog.htm), but be prepared: it is not easy reading!
UML supports two types of diagrams: Structure Diagrams, which you can use to describe statically how an OO system/application is organised, and Behavior Diagrams, for describing dynamically how the various system components interact. In total, there are 13 different types of diagrams, and UML has been criticised for being too complex. My view is that you should understand the basics and apply what you find useful for you. No developer should call herself an OO designer unless she knows at least some UML.
Conceptually, the model of a system consists of three parts. The functional model describes the system functionality from the user's point of view. The key UML diagram in this area is the use case diagram. The object model describes the static system structure in terms of classes, objects, attributes, methods, and relationships among them. Key in this area is the class diagram. The dynamic model describes the internal working of the system. In this area, the key UML diagrams are sequence, activity, and state machine diagrams.
A last word of warning. UML diagrams are only a toolbox to help you model your system. They will support you in specifying and designing OO applications, but they will not do it for you. How good your application is going to be depends almost exclusively on your knowledge, abilities, and dedication.
Structure Diagrams
There are six different types of structure diagrams. They are: class diagrams, component diagrams, composite structure diagrams, deployment diagrams, object diagrams, and package diagrams.
Class Diagrams
Class diagrams model the structure of an application by showing its classes and objects, their attributes, and the relationships between them.
Diagram Elements
Each class is represented as a rectangular box divided into three horizontal sections. The top section shows the class name, the middle section its attributes, and the bottom section its methods. Figure 1 shows a UML representation of a possible DataManager class defined for an eShop application.
Figure 1: Class Diagram - The Class Box
A minus sign preceding a name means “private”, while a plus means “public”. A ‘#’ would mean “protected” and a ‘~’ would mean “package”.
Similar boxes can be used to represent interfaces and objects, while packages are represented with folder-looking boxes.
Relationships
Relationships between classes can be of one of the following four types: generalization, association, aggregation, and composition.
Generalizations model inheritance. If class B extends class A, in UML it is said that A is a generalization of B. A generalization is represented by an arrow with a white triangular head going from to the subclass to the superclass.
Associations model generic relationships between objects, possibly many to many. From a practical point of view, associations are implemented via attributes in Java and foreign keys in relational databases. For example, in an eShop application, you could define a class Order, containing customer and payment data, and a class OrderDetails, containing information on each item ordered. To associate the items to the corresponding order, you could include in OrderDetails the attribute orderID. Figure 2 shows how such a relationship would be modelled in UML.
Figure 2: Class Diagram - Association
The 1..* multiplicity beside OrderDetails indicates that we can have an indefinite number of items associated with a single order, but not less than one. The arrow indicates that you can navigate the association in the direction from OrderDetails to Orders, but not vice versa. This reflects the subordination of OrderDetails to Order: we do not foresee to have something like an attribute OrderDetailsIDs in Order records.
Obviously, in the real world, we would be using UML to model and design our application before writing the code!
Aggregations model a special type of associations in which a "whole" is associated to its "parts". For example, if you define for an eShop the class InsertOrderTag to collect all the information needed to handle an order, you will probably define in it an attribute pointing to an object of type Customer, where the customer’s data is kept. Conceptually, the customer data is considered to be part of the tag object, but it doesn’t actually belong to it. This is important, because when an object belongs to another object, we have a composition (see below), not an aggregation. Figure 3 shows you how an aggregation is modelled with UML.
Figure 3: Class Diagram - Aggregation
Compositions are like aggregations but indicate immutable containment. They model a form of containment in which container and contained objects belong together. If one ceases to exist so do the others. In view of these considerations, the association between orders and order details in an eShop application could be modelled with a composition. This is because it only makes sense to consider an ordered item as part of the order to which it belongs.
A composition is represented in UML like an aggregation but with a black solid diamond arrow head instead of a white one. Also, the multiplicity of the container can only be 1.
Component Diagrams
Component diagrams model the architecture of an application in terms of its physical inter-dependent components.
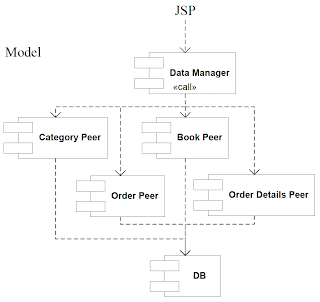
Physical components can be files, headers, link libraries, modules, executables, packages, etc. You could use this type of diagram to describe the organisation of a web application in terms of script files, Java beans, peer classes, etc. Figure 4 shows in UML format an example of the data model structure for an online bookshop.
Figure 4: Component Diagram
Composite Structure Diagrams
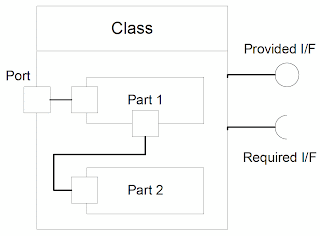
Composite structure diagrams model the runtime structure of classes in terms of their internal parts. A part can be for example a graphical element or a private function.
Parts interact with each other via ports, although a port can also represent the point of interaction of an object (i.e., of a class instance) with other objects, with parts, or with the outside world. A port could be for example a class property or a field, either private or public.
The classes interact with the outside world usually via interfaces, which can be provided (i.e., via class methods) or required (i.e., via invoked methods of other classes).
Connectors similar to those used in the class diagrams link ports and classes.
Figure 5 shows how the various elements are represented.
Figure 5: Composite Structure Diagram
Deployment Diagrams
Deployment diagrams model the hardware used in system implementations, the system components deployed on that hardware, and the associations between those components.
Deployment diagrams consists of hardware nodes (e.g., web server, DB server, client PC, the user!), artefacts (e.g., programs, files, libraries), and associations, which connect artefacts within or across nodes.
Effectively, this type of diagram tells you what is installed where and with what it communicates. For example, Figure 6 shows in UML format the viewing of a JSP (Java Server Page).
Figure 6: Deployment Diagram
Object Diagrams
Object diagrams model a snapshot of the system or part of it taken at a specific time.
Its format is like that of a class diagram, but while the class diagram shows static class relationships, this diagram shows object interactions. Each block is a class instantiation (i.e., an object), not a class.
Package Diagrams
Package diagrams model the hierarchical structure of a system in terms of logical groupings and their dependencies on each other.
If you replace the term "package" with "directory", the meaning of this diagram will become clear! For example, Figure 7 shows you a partial structure of an eShop application.
Figure 7: Package Diagram
Notes:
(1) “Modeling” is the correct American spelling. I will also write other words with the American spelling when they are commonly used in that way.


Very good post
ReplyDeleteThank you!
ReplyDeleteIt has been read more than most of my other posts.
Thanks for creating such a nice post which is really very well written. I will be discussing a lot of friends about this. I am sharing one site for your help http://tjmun.info/best-gadgets-for-assignment-writing
ReplyDeleteThanks for sharing. Try to use this templates http://charts.poweredtemplate.com/powerpoint-diagrams-charts/index.html in future. Your diagrams would be more visually pleasant.
ReplyDeleteAvoid excuses, excuses and accusations - use words that inspire you, inspire confidence and motivate you to act.
ReplyDeleteI suggest adding one more site to your list, where you can download free templates for professional presentations https://imaginelayout.com/powerpoint_diagram-templates/